
e-trainia
Sales Insights

See what drives training business growth

e-trainia’s Sales Insights connects revenue, course performance, learner behavior, and subscription data into one analytics view, giving training businesses clear visibility into what’s driving growth.


See what drives training business growth
See what drives training business growth preview
Learn anywhere
The Visibility Gap

Revenue numbers alone don’t explain growth

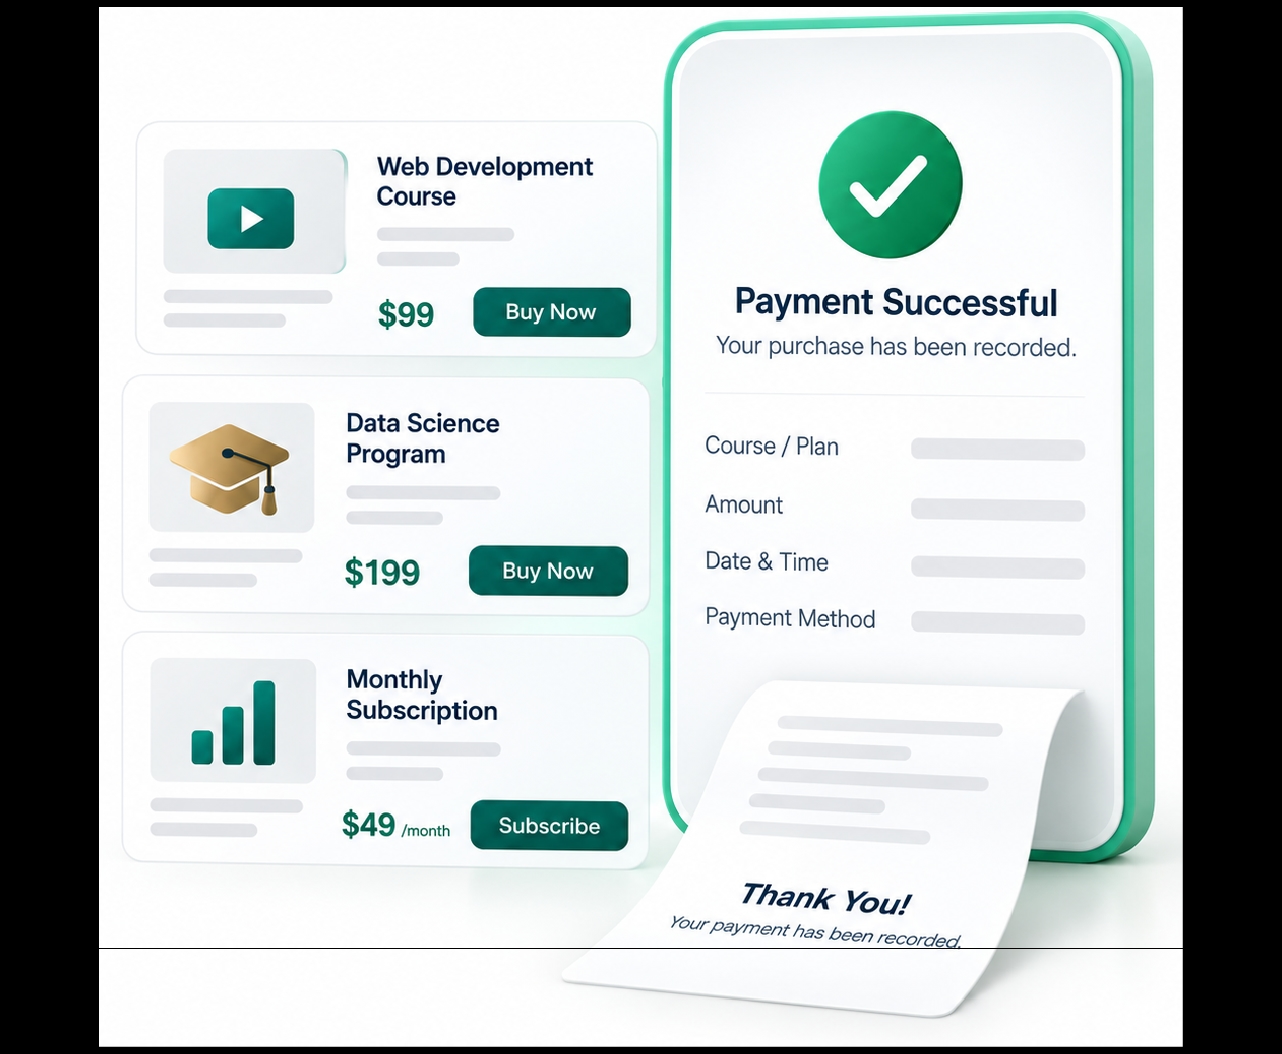
Knowing how much revenue a training business generated is only half the picture. Understanding what’s actually driving or limiting that revenue requires connecting sales data to course and learner performance

e-trainia learning management platform

Disconnected data

When revenue figures live separately from course enrollment, completion, and learner engagement data, it’s difficult to understand why revenue is moving.

Hidden drop-off

Without visibility into learner behavior, a training business can’t see where learners lose interest or abandon a course.

Unclear subscription health

Recurring revenue depends on subscriber retention, but without dedicated tracking, churn and renewal patterns are easy to miss.

Manual reporting

Compiling revenue, enrollment, and completion data manually takes time that could be spent acting on what the data shows

Core Capabilities

What Sales Insights covers

e-trainia connects four specific, confirmed capabilities that together give training businesses commercial visibility into their courses and learners.
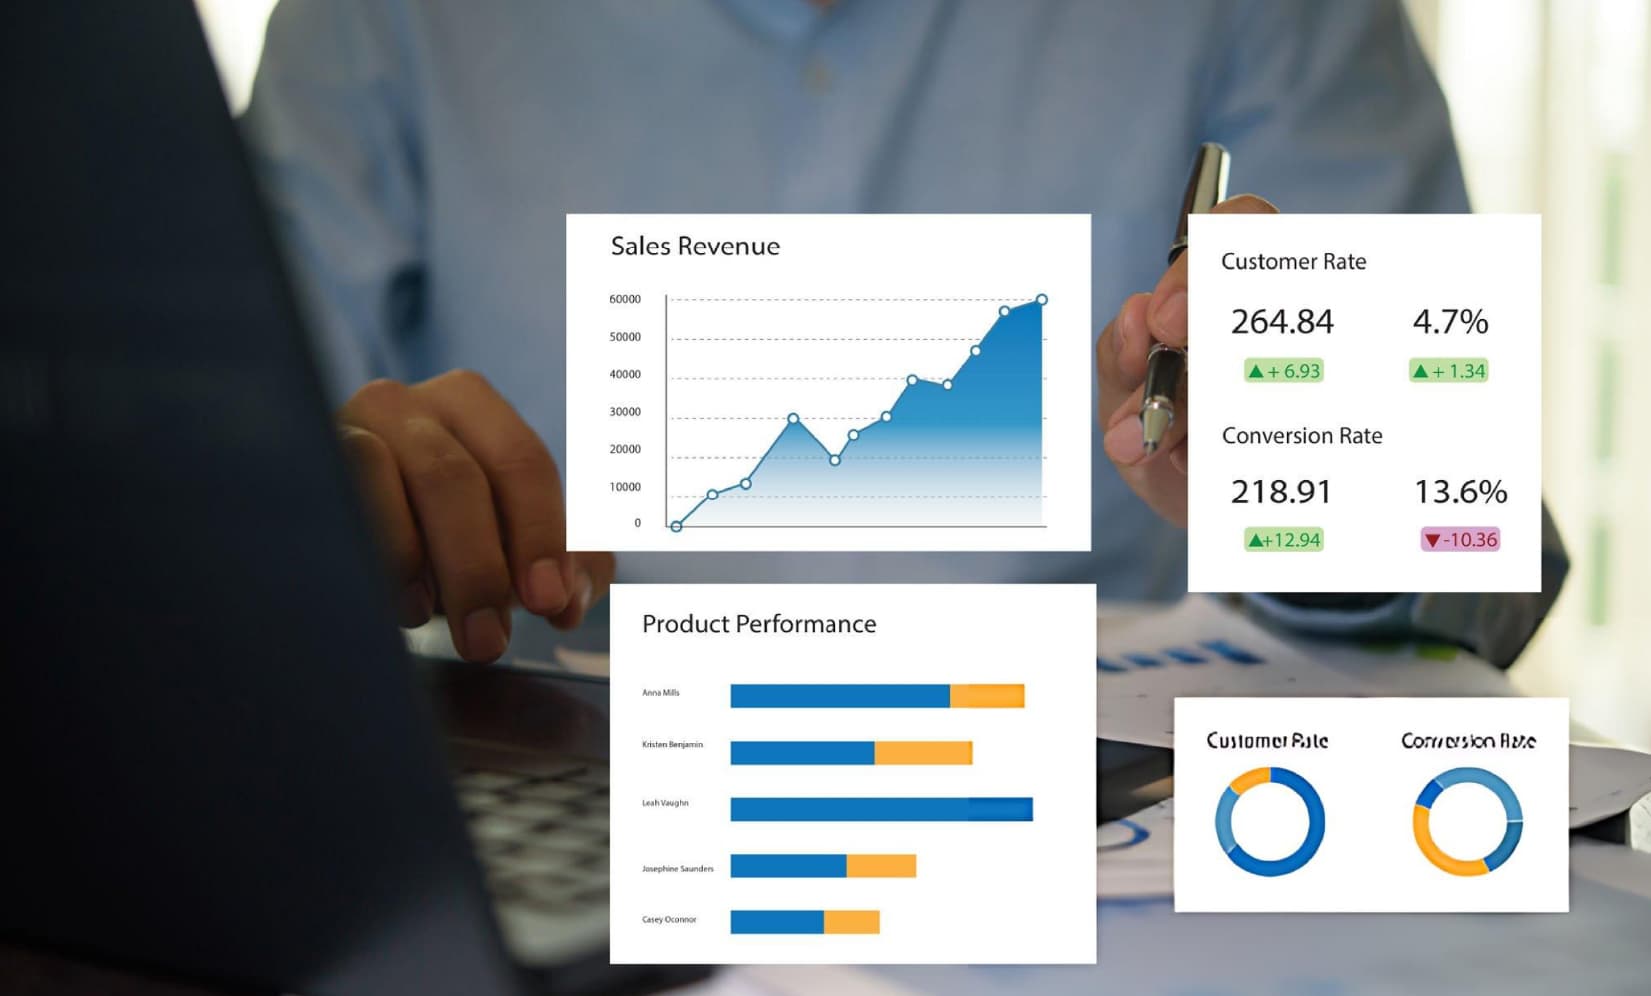
Live revenue dashboards
01  /  Track

Live revenue dashboards

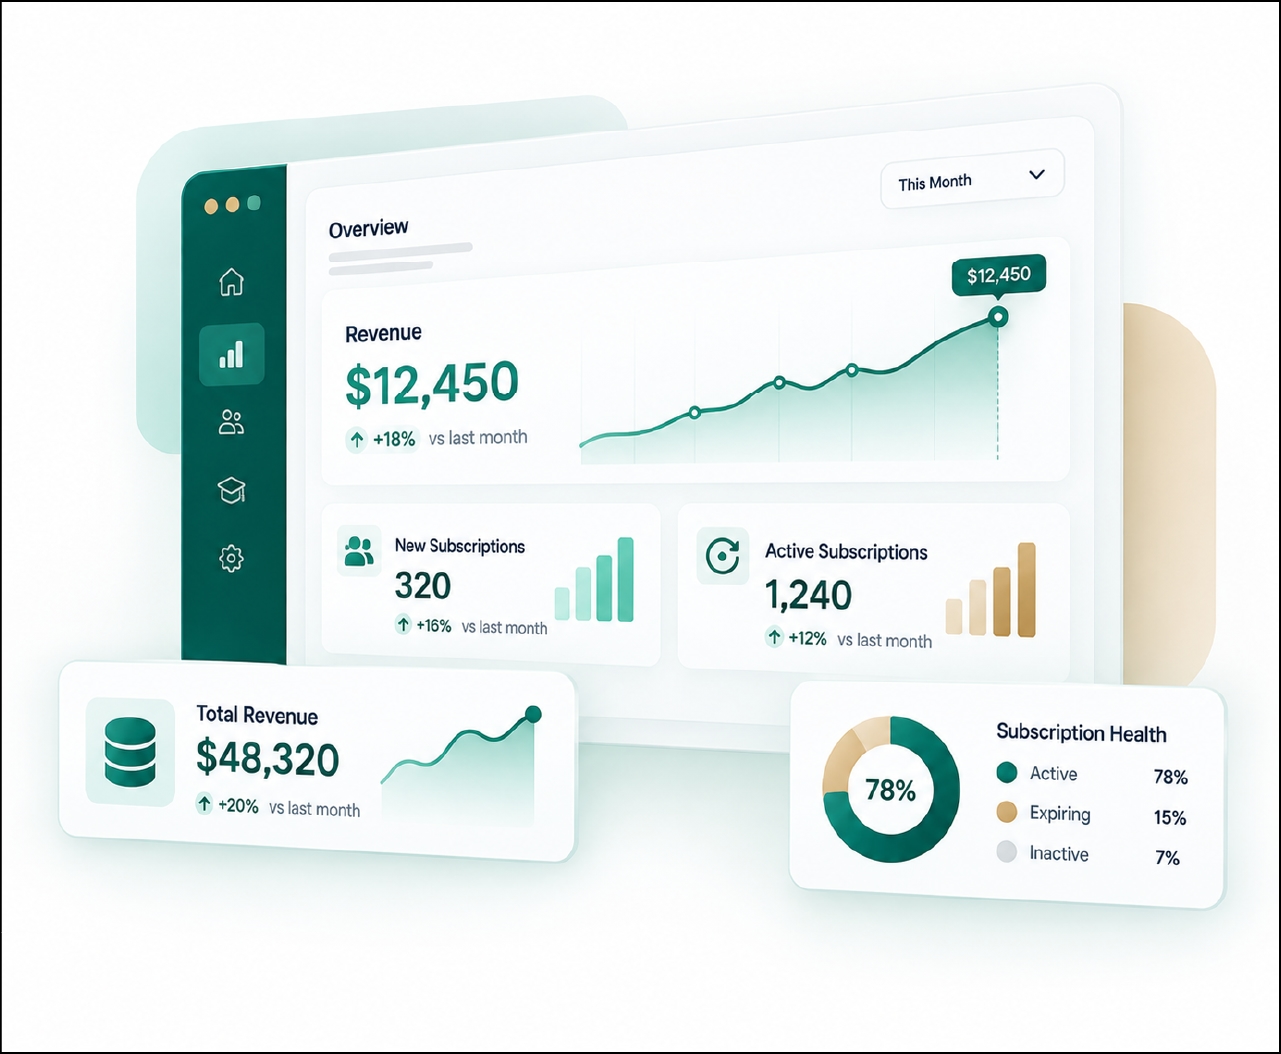
See total revenue, per-course revenue, and average order value, filterable by date range, course, or learner segment.

  • Total and per-course revenue
  • Average order value
  • Filterable by date and segment
Course-level performance
02  /  Evaluate

Course-level performance

Identify which courses drive revenue, how enrollment converts to completion, and which courses are consistently.

  • Revenue by course
  • Enrollment-to-completion rates
  • Abandoned course visibility
Learner behavior analytics
03  /  Understand

Learner behavior analytics

See content engagement, skipped sections, video replays, and where learners drop off within a course.

  • Content engagement data
  • Skipped sections & replays
  • Drop-off point visibility
Subscription health tracking
04  /  Monitor

Subscription health tracking

Track active subscribers, monthly recurring revenue, churn rate, and renewal patterns.

  • Active subscriber counts
  • MRR & churn tracking
  • Renewal pattern visibility
How It Works

From raw activity to commercial visibility

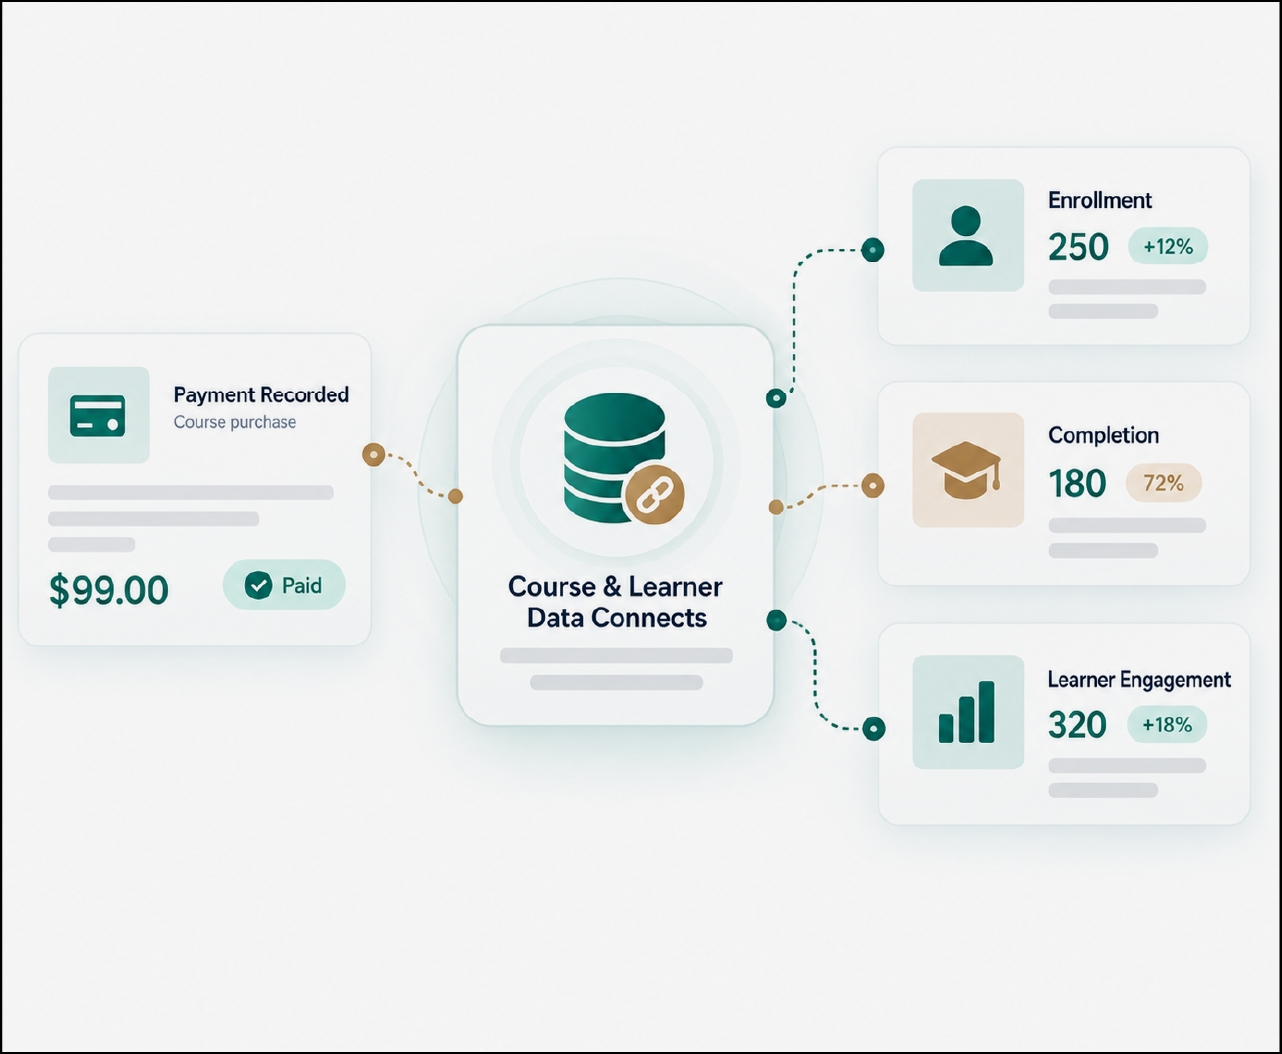
e-trainia pulls revenue, enrollment, completion, and subscription data into one connected analytics view, without requiring administrators to compile it from separate systems.

Why It Matters · 05

Growth decisions need connected data, not isolated numbers

01

Value · 01

Revenue

Live & filterable (see revenue totals and breakdowns updated in real time)

02

Value · 02

Performance

Course-level detail (understand which courses drive revenue and which don’t)

03

Value · 03

Behavior

Learner engagement data (see where learners engage and where they drop off)

04

Value · 04

Retention

Subscription health (monitor MRR, churn, and renewal patterns together)

Questions, Answered

Frequently asked questions

Yes, live revenue dashboards can be filtered by date range, course, or learner segment.

Yes, it tracks active subscribers, monthly recurring revenue, churn rate, and renewal patterns.

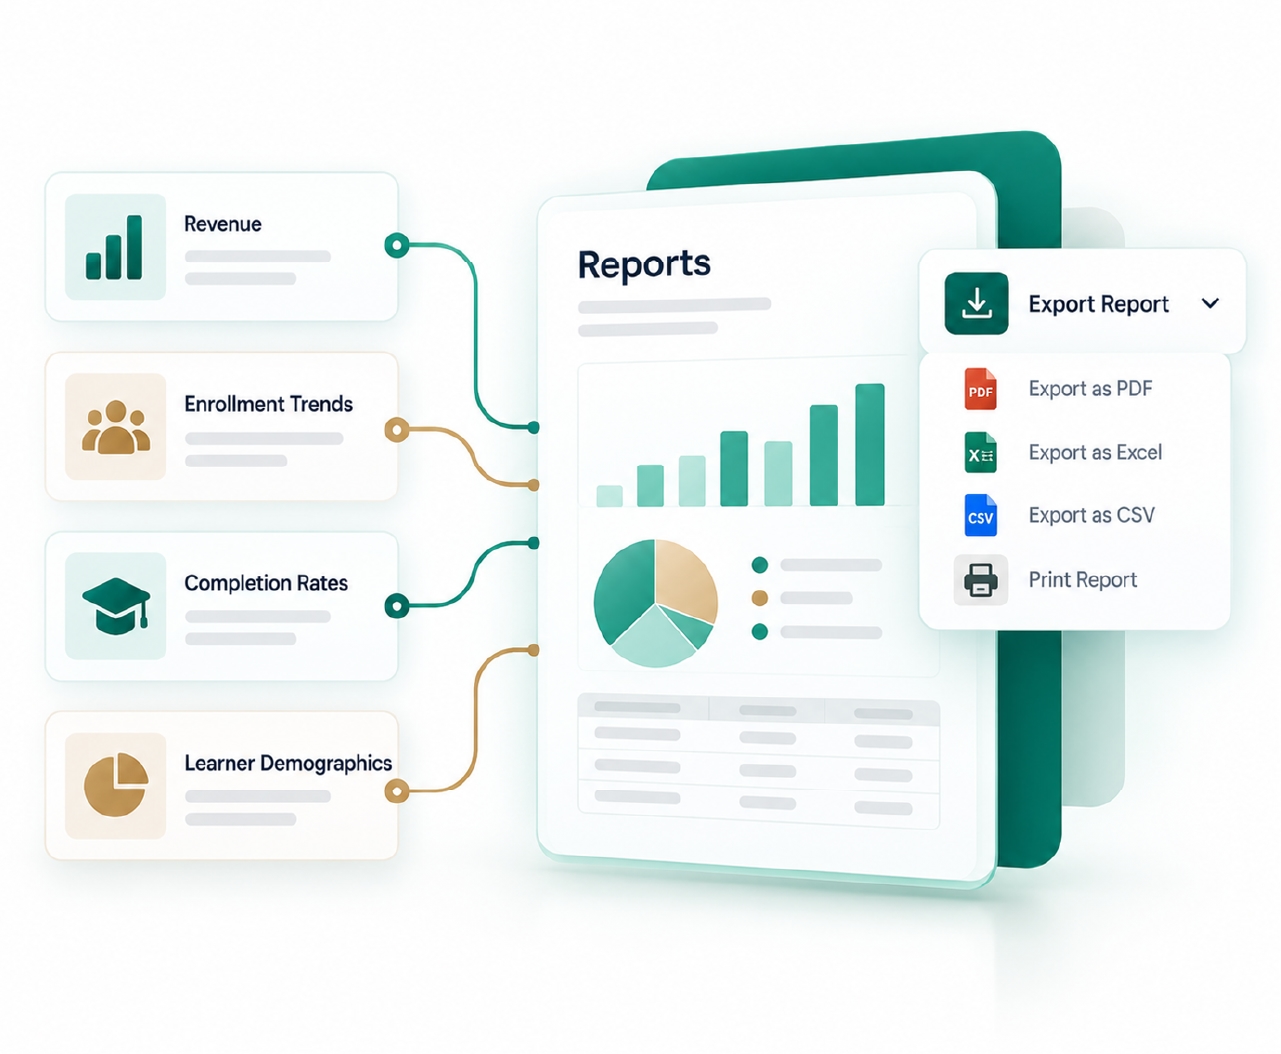
Yes, exportable reports cover revenue, enrollment trends, completion rates, and learner demographics.

Yes, learner behavior analytics show content engagement, skipped sections, video replays, and drop-off points.

Training providers, online course businesses, EdTech companies, corporate training businesses, and education businesses selling training at scale.
Ready To Get Started

See what’s actually driving
your growth

See how e-trainia’s Sales Insights connects revenue, course performance, and subscription data into one clear commercial view.